The evolution of topics is presented with (1) annual data and (2) decades. Hover over the charts to get interactive details. You can click on the entries in the legend to switch on/off selected topics.
- Annual evolution
View the figure on Chart Studio. Click here:https://chart-studio.plotly.com/~salesai/5
2. Evolution in decades.
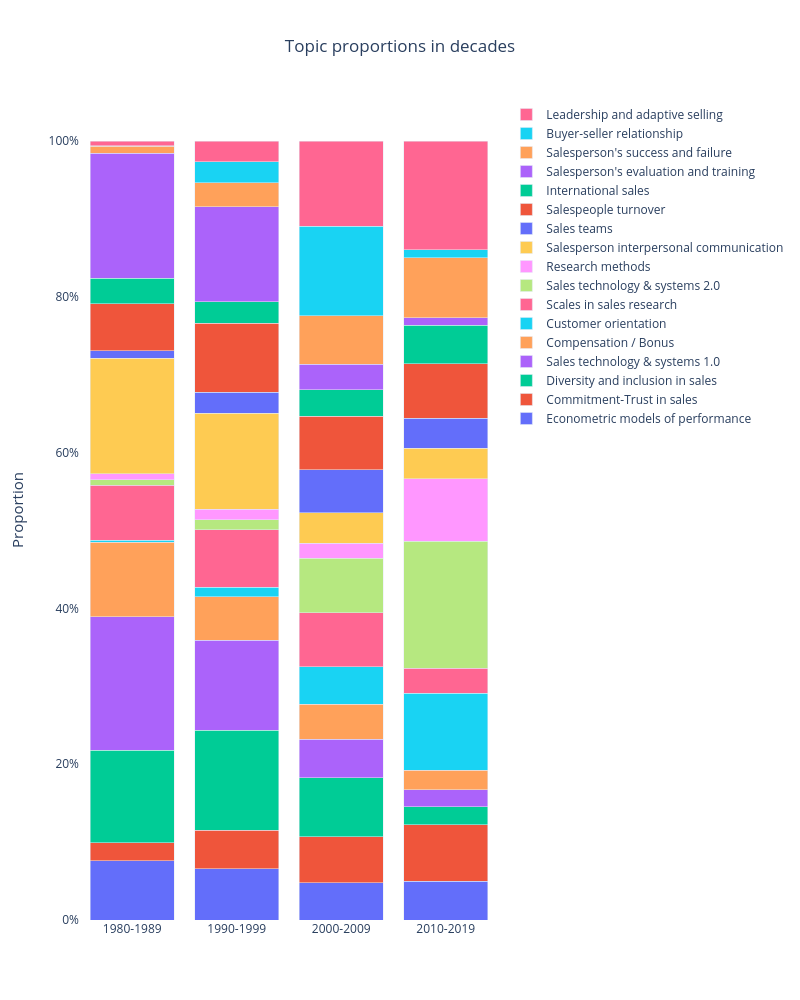
View the figure on Chart Studio. Click here: https://chart-studio.plotly.com/~salesai/7